New Jersey’s Remaining Landfill Solar Potential: A LiDAR-Measured Statewide Inventory
2.6–3.9 GW of remaining capacity, measured from statewide LiDAR across all 412 closed landfills in the NJDEP registry — published as an honest bracket and validated against built precedent, finer data, and time.
Citipax Atlas · Ben Hemberger · July 2026
Download: data & figures ship with the study — see Research & Evidence · full citation register: citations.json
For press — the 90-second version
- The finding: New Jersey’s 412 closed landfills hold 2.6–3.9 GW_dc of remaining solar capacity — the first LiDAR-measured statewide estimate anywhere, published as an honest anchor-to-bound bracket.
- The method, in one line: slope-classified buildable envelopes computed from the state’s elevation point cloud for every registry site (validated against finer 3-ft terrain and 11 built NJ arrays), not registry acreage times a rule of thumb.
- Why it matters now: the BPU reserved 300 MW of community-solar capacity for landfill/brownfield projects on March 6, 2026, first-come-first-served — and as displayed by the program portal on July 9, 2026, that block shows 0 MW subscribed. The measured resource is nine to thirteen times the reserve.
- The wall: county aggregates and public NJDEP registry identities only — no parcel identifiers, no owner data, methodology and every figure receipted.
Press contact: ben@citipax.org · data walkthroughs available on request.
Abstract
New Jersey’s community-solar program opened a 300 MW capacity carve-out for landfill-sited projects in March 2026, awarded first-ready/first-served [1] — yet no state-level estimate of remaining landfill solar capacity has ever been published: the canonical national figure (≥63 GW across 4,312 closed U.S. landfills [3]) was never resolved below national scale, and published capacity-density coefficients derive from open-field construction rather than capped landfills [6,7]. This study measures, rather than assumes, the remaining potential of New Jersey’s closed-landfill inventory. We compute slope-classified, contiguity-filtered buildable envelopes for all 412 closed landfills in the NJDEP solid-waste registry from the statewide LiDAR-derived elevation model; convert acreage to capacity using both an empirical landfill-specific density coefficient (derived from verified built arrays) and the measured envelope, publishing the two as a deliberate bracket; classify site control from public-record property classes; grade cap-surface stability from two public elevation epochs where both exist; and subtract known-built sites via a hand-verified match against EPA’s RE-Powering inventory [2]. Results: 15,042 footprint acres yield 11,439 slope-screened buildable acres; gross potential brackets at 3,008–4,489 MW_dc, and 2,769–4,151 MW_dc net of the 17 sites already hosting arrays — enough to fill the state’s carve-out roughly nine to thirteen times over. The method is validated three independent ways: against the largest built landfill array in North America (screen bound 23.2 MW vs 25.6 MW built); against an eleven-times-finer direct point-cloud extraction — piloted over 31 Bergen County sites (r = 1.000, mean −5%) and, in v1.1, extended statewide to 361 site pairs (r = 0.998, mean −11%, rank order preserved); and against time, via a 17-site two-epoch settlement pilot that measured the 462-acre American Cyanamid Superfund cap at +0.03 ft median movement over eight years. All numbers are reproducible from versioned model outputs and public data; every methodological constant, exclusion, and known bias is documented herein. We disclose a commercial interest: the authoring firm sells site-screening services built on this study’s engine (§ Disclosure).
Keywords: landfill solar, brightfields, LiDAR, buildable area, community solar, New Jersey, brownfield redevelopment, differential settlement
1. Introduction
1.1 The policy moment
On March 4, 2026, the New Jersey Board of Public Utilities (BPU) ordered open 3,000 MW of Community Solar Energy Program (CSEP) capacity — the largest single opening in the program’s history — including a 300 MW carve-out reserved for landfill-sited projects, applicable in any electric distribution company’s territory, awarded first-ready/first-served until subscribed or December 31, 2029 [1]. The same order set the administratively determined incentive at $60/MWh for registrations on or after March 6, 2026, required minimum subscriber bill-credit discounts of 20% (25% for low- and moderate-income subscribers), and granted landfill and contaminated-site projects 24 months to reach permission-to-operate against 18 for other siting classes — an institutional acknowledgment that these sites carry longer engineering and permitting paths [1].
The carve-out did not emerge in a vacuum. New Jersey’s siting policy has progressively privileged disturbed land: the NJDEP Solar Siting Analysis (v3.0, 2024) scores “Landfill Extents” at +30, the most-preferred ground-mount category in the state’s framework [5]; the Department maintains dedicated permitting guidance for solar on closed sanitary landfills, including a four-route construction-approval taxonomy [4]; and the New Jersey Economic Development Authority’s Brownfields Redevelopment Incentive can return up to $8–12 million of remediation and capping cost as a transferable tax credit, making even uncapped municipal landfills addressable when closure is financed with the project [16]. Against a 2050 target of roughly 32 GW of installed solar under the state Energy Master Plan — about 27 GW beyond today’s installed base [5] — the question of how much capacity the state’s closed landfills can actually host is a first-order input to both program design and private capital allocation.
1.2 The estimation gap
That question has never been answered with measurement. Rocky Mountain Institute’s national assessment estimated that 4,312 closed U.S. landfills with adequate data could host at least 63 GW_dc producing 83 TWh annually [3]; the study was foundational in establishing the asset class’s scale but was constructed from registry acreages and generic density assumptions, and was never resolved to state level. The U.S. EPA’s RE-Powering program tracks completed projects — 332 landfill-sited solar installations totaling 1,010 MW nationally as of December 2024, with New Jersey second among states at 119 installations on contaminated lands [2] — but tracks no forward-looking potential. Published capacity-density coefficients are open-field: Ong et al.’s widely cited 2013 figures [6] and Bolinger & Bolinger’s 2022 empirical update [7] both characterize greenfield utility-scale construction, and no landfill-specific packing density had been published prior to the coefficient derived for this study’s engine (§ 3.7, [21]). Meanwhile, practitioner reporting documents why registry acreage is a poor proxy for landfill capacity: “a 50-acre landfill could quickly become 15 acres of usable space” once side slopes, gas infrastructure, and setbacks are accounted for [13].
The result is an asymmetry: policy has created a time-boxed, first-ready race on a siting class whose statewide capacity is unquantified, whose per-site buildable area is systematically overstated by the only publicly available acreage figures, and whose highest-value screening questions (what is flat, what is contiguous, what is stable, who controls it) are answerable from public data that nobody had processed.
1.3 Research questions
RQ1. How much buildable area, and how much plausible capacity, remains on New Jersey’s closed-landfill inventory when buildability is measured (slope-classified and contiguity-filtered from LiDAR) rather than assumed from registry acreage?
RQ2. How faithful is a statewide 10-ft screen to finer-resolution ground truth — i.e., can a screening product be trusted to rank and bound sites without site-by-site point-cloud work?
RQ3. Can cap-surface stability — the dominant engineering unknown for ballasted racking on closed landfills — be graded at screening cost from public multi-epoch elevation data, and with what sensitivity?
RQ4. How is the remaining potential distributed across counties, ownership situations, and control paths, and what does that distribution imply for the carve-out’s design and uptake?
1.4 Contributions
- The first state-level, measurement-based inventory of remaining landfill solar potential anywhere in the U.S., published as an honest anchor-to-bound bracket rather than a point estimate (§ 5).
- A slope + contiguity buildable-envelope method for capped landfills, with every constant documented and its upper-bound semantics stated wherever the numbers appear (§ 4.1).
- A landfill-specific empirical capacity-density coefficient (0.20 MW_dc/capped-acre; 0.40 MW_dc/built-array-acre), derived from verified built arrays and benchmarked against the open-field literature (§ 3.7).
- A three-way validation protocol — against built precedent, against 11×-finer independent extraction, and against time via two-epoch settlement grading with per-site sensitivity floors (§ 6).
- A privacy-preserving ownership/control classification that reduces cadastral data to public-record property classes, demonstrating that deal-relevant texture can be published without identifying any owner (§ 4.5, § 4.7).
1.5 Organization
Section 2 reviews the policy and technical literature. Section 3 documents every dataset, including known quality issues. Section 4 specifies the methods, constants, and their rationale. Section 5 reports results; Section 6, validation; Section 7 discusses implications, quantified limitations, and future work. Appendices carry the full county table, the constants registry, the known-built match log, and reproducibility artifacts.
2. Background and related work
2.1 Brightfields nationally
Solar redevelopment of contaminated and disturbed land — “brightfields” — is a mature niche with two decades of precedent (the Brockton, MA demonstration dates to 2006). EPA’s RE-Powering America’s Land initiative, which provides screening data and tracks completions, reports 624 completed renewable installations on contaminated lands, landfills, and mine sites (4,368.8 MW) as of its December 2024 matrix; 53% of installations are on landfills or landfill buffers, 88% are solar PV, and the modal project is small — 80% are 5 MW or less [2]. Municipal ownership is the largest ownership category (287 installations), consistent with the historical pattern of towns monetizing closed municipal solid-waste sites [2]. Corporate owners have recently moved from one-off hosting toward portfolio-scale programs; Waste Management’s January 2026 agreement to develop solar and/or storage on at least 50 of its closed sites is the largest such commitment to date [25].
New Jersey’s position in this niche is second nationally by installation count [2], and its landfill precedents include the largest landfill array in North America (Mount Olive/Combe Fill North, 25.6 MW_dc, energized December 2022 [17]); the practitioner assessment of the state’s remaining inventory is blunt: “only inactive or improperly closed landfills remain without solar” [13]. That claim — which this study’s ownership and match analysis broadly corroborates for large, well-documented, properly closed sites while refuting it in aggregate (§ 5.5, § 7.4) — frames the remaining opportunity as a hard tail problem: sites with title complications, uncertain closure status, and unmeasured surfaces.
2.2 New Jersey policy history: from SREC carve-outs to the 300 MW race
The state’s landfill-solar incentives have moved through four regimes, and the transition seams are instructive. Under the Solar Act’s “subsection t” grid-supply category, landfill/brownfield projects earned premium SREC treatment; the Transition Incentive (TREC) program closed to new registration in August 2021. In the first eight months of the successor Administratively Determined Incentive under the Successor Solar Incentive (SuSI) program, zero landfill or brownfield grid-supply applications were filed — the $100/MWh interim incentive was insufficient for the higher civil, racking, and compliance costs of these sites [14]. The Competitive Solar Incentive (CSI) program that followed reserves its Tranche 3 for contaminated sites and landfills; in the third solicitation (awarded March 4, 2026), a single landfill project cleared at $124/MWh against $80/MWh for built-environment awards — an observed ~$44/MWh landfill premium — while five of six prequalified Tranche-3 projects were rejected above confidential price caps [26]. The lesson embedded in both episodes is that landfill economics are real but tight, and that incentive design repeatedly under- or over-shoots them.
The CSEP permanent program (N.J.A.C. 14:8-11, adopted August 2023 [15]) absorbed the ≤5 MW segment, allows up to 10 MW co-located on uncapped municipal landfills, and — after successive annual capacity blocks were oversubscribed — was expanded by L. 2025 c.135 and Executive Order No. 2 (January 2026) into the March 2026 order studied here: 3,000 MW opened, with the 300 MW landfill carve-out and its first-ready/first-served award rule [1]. Complementing the incentive stack: NJDEP’s February 2024 permitting guidance for solar on closed sanitary landfills specifies a pre-application process, a Minor Disruption Approval for investigative borings, four construction-approval routes keyed to the site’s closure history, professional-engineer-supervised construction, and ecological provisions (pollinator/grassland-bird management) descending from the Solar Act of 2021 [4]; and the NJEDA Brownfields Redevelopment Incentive finances capping for the close-with-solar pattern demonstrated at Berkeley Township (two 5 MW community-solar projects that closed an uncapped municipal landfill at no taxpayer cost) [16,19].
2.3 Capacity-density literature and the landfill gap
Capacity-per-acre assumptions drive every acreage-based potential estimate, and the literature is open-field. Ong et al. (2013) established the long-standing NREL land-use figures [6]; Bolinger & Bolinger (2022) updated them empirically from as-built utility-scale projects, finding substantially higher packing densities in modern construction [7]. Neither characterizes capped landfills, whose densities are structurally lower: ballasted (non-penetrating) racking at wider spacing, cap-edge setbacks, methane collection wells and flares, leachate infrastructure, and slope/settlement exclusions all consume area that open fields do not surrender. The coefficient used here (§ 3.7) was derived from verified built landfill arrays to fill that gap; its headline values — median 0.25 MW_dc per built-array-acre (n = 11 unique projects; range 0.169–0.40), and ≈0.20 MW_dc per total capped acre, decomposing into a ≈0.50 cap buildable fraction × 0.40 MW_dc/array-acre packing density — imply a ~29% density derate versus Bolinger open-field on an array-footprint basis, and ~43% on a whole-cap basis [21]. This study’s envelope measurement replaces the assumed 0.50 buildable fraction with per-site measurement, which is precisely what makes the resulting figure an upper bound: the measured envelope still cannot see gas wells, setbacks, or leachate lines (§ 4.1.5).
2.4 Practitioner-documented failure modes
Trade reporting and program records catalogue where landfill projects die, and the catalogue reads as a specification for what a credible screen must address [13,14,26]: interconnection cost and feeder availability; usable-area collapse relative to registry acreage; cap integrity and differential settlement (with its NJPE-sealed analysis requirements [4]); title chaos on abandoned sites — accrued liens, disputed ownership — which the Mount Olive transaction resolved via municipal tax-lien assignment and redevelopment designation [17]; incentive-economics mismatch (§ 2.2); and per-municipality permitting inconsistency. Sections 4.1, 4.4, and 4.5 operationalize the three of these that are measurable from public data at screening cost (usable area, settlement, control), and § 7.6 quantifies what remains outside the screen.
3. Data
All datasets are public. Table 3.1 summarizes; the subsections document provenance and known defects. No parcel-owner-identifying data is used anywhere in this study’s public statistics (§ 4.7).
Table 3.1 — Data inventory
| Dataset | Provider · vintage | Role | Known issues (documented) |
|---|---|---|---|
| Closed sanitary landfill registry (412 polygons) | NJDEP solid-waste program; extract 2026-06-15 | The universe | Some polygons map property/site boundaries rather than fill extents (§ 3.1) |
| Statewide 10-ft DEM (LiDAR-derived) | NJDEP/NJOGIS “statewide_2021” compiled product | Envelope screen surface | Source-flight vintage varies by county (§ 3.2) |
| USGS 2014 post-Sandy LAS point cloud, Bergen block (344 tiles, 78 GB) | USGS 3DEP, NJ_SdL5_2014 (QL2) | Resolution validation | No CRS VLR in headers; class-1 high noise (§ 3.3) |
| USGS NJ_NE6Co_3_B23 OPR DEM (1-ft) | USGS 3DEP; flown Apr 2025, published 2026-04-08 | Settlement epoch B | Final vertical-accuracy assessment pending (§ 3.4) |
| EPA RE-Powering tracking matrix | U.S. EPA, December 2024 | Known-built subtraction | Name-keyed; no site identifiers (§ 3.5) |
| Cadastral property classes (MOD-IV lineage) | NJ parcel composite + assessment records | Control classification | Stacked/condominium lots can double-count intersection acreage (§ 3.6) |
| Verified built-array evidence base | Compiled from primary project records, 2026-06 | Density coefficient | Mixed acreage bases; handled by basis-typed medians (§ 3.7) |
3.1 The landfill universe
The NJDEP solid-waste registry’s closed-landfill layer contributes 412 MULTIPOLYGON footprints totaling 15,042 acres (extract of 2026-06-15, served from the Department’s public ArcGIS infrastructure). County attribution and municipality are carried as feature attributes. Two registry-quality caveats matter to everything downstream. First, polygon semantics vary: most footprints plausibly trace fill extents, but some trace site or property boundaries — the flagged exemplar is the 1,114-acre Leesburg polygon in Cumberland County, whose scale and uniformly buildable surface (§ 5.4) are consistent with a property boundary at a state facility rather than a waste footprint. We therefore report the statewide totals both with and without this single site (§ 7.6.1). Second, no official count of New Jersey’s closed landfills is published against which the registry can be reconciled; figures in circulation (e.g., “800+ abandoned landfills”) are unsourced and are not used here. The registry is the defensible universe: it is the layer the State itself uses for landfill-solar program routing [16].
3.2 The statewide elevation model
The “statewide_2021” DEM is NJDEP/NJOGIS’s compiled best-available LiDAR-derived elevation product: 10-ft cells, EPSG:6527 (NAD83(2011) New Jersey State Plane, U.S. survey feet), elevations in feet (NAVD88; geoid realization follows each source flight). Because it is a compilation, source-flight vintage varies by county: the northeastern counties including Bergen derive from the 2014 post-Sandy flight; the northwest six-county block (including Somerset) from 2017-18 QL2 acquisitions; and southern counties from 2019-2020 QL2 flights. Two consequences are handled explicitly: (i) envelope measurements on actively settling caps reflect the source-flight date, not the present — the motivation for the settlement layer (§ 4.4); (ii) any two-epoch differencing against a newer product inherits a county-specific epoch-A date and geoid realization, which the settlement method removes empirically rather than by geoid-grid transformation (§ 4.4.2).
3.3 The Bergen point cloud (resolution-validation epoch)
The USGS NJ_SdL5_2014 collection (post-Sandy, QL2, ~0.7 m nominal pulse spacing, RMSE_z 0.058 m open-terrain per the collection metadata) covers Bergen County in 344 LAS 1.2 tiles (78 GB, point format 1). Three defects required handling. (1) No CRS VLR: tile headers carry no coordinate reference system; horizontal EPSG:6347 (UTM 18N, meters) and vertical NAVD88 GEOID12A meters are asserted from collection metadata and verified against tile bounds and elevation ranges, and the assumption is recorded in the derived products’ provenance. (2) Elevations in meters against an engine standard of U.S. survey feet: the unit law z_ftUS = z_m × 3937/1200 is applied exactly once, at product generation, and recorded. (3) High noise resides in class 1 (unclassified), not the designated noise class: 58 of 344 tiles contain points above 360 m — Bergen’s terrain tops out near 355 m — with a worst case of 925.5 m; a physical elevation ceiling (400 m) excludes these from the surface model, with rejected counts logged (three points survived to the ceiling in the final run). Classes 7 (noise) and 17/18 (overlap/edge classes in this delivery) are excluded from both derived surfaces; the bare-earth model uses class-2 (ground) returns and the surface model first returns of classes {1, 2, 9}.
3.4 The 2025 OPR DEM (settlement epoch B)
The USGS NJ_NE6County_B23 project’s first published workunit (NJ_NE6Co_3_B23; Somerset County; flown April 2025; published 2026-04-08) includes an original-product-resolution DEM at 1-ft cells in compound EPSG:6527 + NAVD88 ftUS (GEOID18). The project’s remaining workunits — including Bergen County — were unpublished as of this study’s data date; consequently settlement grading is piloted in Somerset (the only county with two published epochs) and becomes runnable per county as workunits publish (§ 4.4.4). The workunit’s final absolute vertical accuracy assessment was pending at access time (“expected to meet” the ~10 cm RMSE_z QL1 class [10]); the error budget in § 4.4.3 uses the specification value pending the final assessment. Access is via HTTP range reads against the published project mosaic — no bulk download — with only the windows over analyzed sites transferred.
3.5 The known-built inventory
EPA’s RE-Powering tracking matrix (December 2024 edition) lists 28 New Jersey installations whose site type includes “landfill,” with project name, city, type, technology, capacity, and completion date [2]. The matrix carries no site identifiers linkable to the NJDEP registry, so known-built subtraction requires the name-matching protocol of § 4.6.
3.6 Cadastral property classes
Control classification (§ 4.5) uses the New Jersey parcel composite’s property-class attribute (MOD-IV lineage: public/exempt classes 15A–15F; vacant class 1; farm 3A/3B; residential 2; commercial/industrial/apartment 4A–4C) and parcel geometry, intersected with landfill footprints. Two thousand four hundred sixty-three parcels intersect 396 of the 412 footprints; intersection acreage apportions each parcel’s contribution. A known cadastral artifact — stacked condominium/qualifier lots duplicating base-lot geometry — can inflate intersection totals; the engine records a per-site inflation ratio and flags affected sites rather than silently correcting (§ 7.6.4). No owner names, addresses, or other identifying attributes are read at any point in this pipeline; class codes and geometry only (§ 4.7).
3.7 The built-array evidence base and the density coefficient
The landfill-specific density coefficient [21] was derived in June 2026 from a compiled evidence base of verified closed-landfill arrays with published capacity and acreage (40+ observations across ~30 unique projects after source deduplication; acreage figures were basis-typed as array-footprint, cap-area, or total-site before use). Headline statistics:
- 0.25 MW_dc per built-array acre (median, n = 11 unique projects with array-footprint or cap-area basis; range 0.169–0.40; ≈4.0 ac/MW_dc);
- ≈0.20 MW_dc per total capped acre, decomposed as a 0.50 cap buildable fraction (empirical band 0.45–0.55; conservative whole-property floors of 0.32 at GEMS and 0.37 at Kearny 1A) × 0.40 MW_dc/array-acre packing density;
- an implied DC:AC inverter loading ratio ≈1.2 (≈0.16–0.17 MW_ac per capped acre);
- a ~29% density derate vs. Bolinger open-field on an array-footprint basis (0.25 vs 0.35 MW_dc/acre), steepening to ~43% on a whole-cap basis — driven by ballasted-racking spacing, cap-edge setbacks, gas wells/flares, leachate lines, and slope/settlement exclusions [7,21].
New Jersey anchors in the base include Mount Olive (25.6 MW; 0.25 MW_dc/acre on the 102-acre site basis; 0.51 on the ~50-acre array footprint) [17], GEMS (4.5 MW on 19 array acres; 0.237) [18], L&D (12.93 MW; 0.24–0.26 across bases) [20], Parklands (10.14 MW / 40 cap acres) [20], Eagles I & II at Berkeley Township (10 MW / 40 cap acres) [19], Cinnaminson (13 MW / 25 array acres; 0.52), and Kearny 1A (3 MW / 13 array acres; 0.231) [20]. Out-of-state comparables span Houston’s Sunnyside (52 MW / 240 total acres; 0.217) to small New England municipal caps; two low-density outliers (Parkton, MD at 0.033 and Bristol, RI at 0.075, both total-site basis on largely unbuilt properties) illustrate exactly why basis-typing matters and why whole-property acreage is not a capacity proxy.
4. Methods
All computation runs against versioned model outputs; every constant below is registered with rationale in the engine’s calibration documentation and snapshotted per-row into the outputs’ provenance fields. The engine CRS is EPSG:6527/3424 (New Jersey State Plane, U.S. survey feet); areas derive from cell counts (10-ft cell = 100 sq ft; 435.6 cells/acre).
4.1 Buildable-envelope extraction (model landfill-envelope-v0)
4.1.1 Surface derivatives. For each footprint, a padded window of the statewide DEM is read (3-cell pad so kernels at the boundary see full neighborhoods; boundless reads with nodata fill preserve the coverage accounting invariant when a footprint abuts the raster edge). Slope and aspect derive from Horn’s (1981) third-order finite-difference kernel [8], the same formulation as standard GIS tooling: with the 3×3 neighborhood labeled a…i (row 0 north),
dz/dx_east  = ((c + 2f + i) − (a + 2d + g)) / (8·w)
dz/dy_north = ((a + 2b + c) − (g + 2h + i)) / (8·w)
slope%      = 100·√((dz/dx)² + (dz/dy)²)
aspect      = atan2(−dz/dx, −dz/dy) mod 360°   (downslope-facing, clockwise from north)
with w the cell size in feet. Cells lacking a complete valid neighborhood (nodata-adjacent or border) are excluded from classification and tracked separately — absence is never classified.
4.1.2 Slope classes. Cells classify as prime (≤ 8%), conditional (8–15%), or excluded (> 15%). The bounds are a documented v0 engineering screen, not a stability finding: 8% represents the ballasted-racking comfort zone on cap plateaus observed across the precedent base (§ 3.7); 8–15% is buildable with engineering review and approaches side-slope territory; above 15% lies the side-slope regime (landfill side slopes are typically graded 25–33% and are never arrayed). NJDEP’s permitting framework requires professionally sealed settlement and side-slope analyses regardless [4]; the class bounds prioritize where that spend is worthwhile.
4.1.3 Contiguity. The buildable candidate (prime ∪ conditional) is filtered to 8-connected components of at least 2 acres (871 cells at 10-ft resolution): fragments below ~2 acres cannot host a meaningful sub-array with access. The surviving envelope is stored as geometry (simplified at half a cell) alongside per-class acreages, the largest-component acreage, and component count. A site-level flag marks envelopes of at least 5 developable acres, following the practitioner sizing rule that smaller sites rarely pencil (≈5 acres ≈ 1 MW) [22]; the flag never drops a site from the inventory.
4.1.4 Aspect weighting. Cells steeper than 5% receive mild orientation factors (south-facing 1.00; east/west 0.95; north-facing 0.85; flat cells 1.00 regardless), yielding effective acres used in the envelope-side capacity conversion. These factors are the model’s weakest constants — engineering judgment pending a plane-of-array simulation study — and are flagged as such in every output row’s provenance.
4.1.5 Upper-bound semantics. The envelope measures slope and contiguity only. Gas wells and flares, leachate infrastructure, cap-edge setbacks, access roads, and stormwater features are invisible to it. Consequently buildable_acres, effective_acres, and the derived MW figures are upper bounds by construction, and are labeled as such wherever they appear; the empirical anchor (§ 4.2) exists precisely to bracket this overstatement from below. Where the DEM offers no coverage, outputs are NULL — unmeasured, distinct from zero — a distinction preserved through every downstream table in this study.
4.2 Capacity conversion: the bracket
Two conversions are computed and always published together:
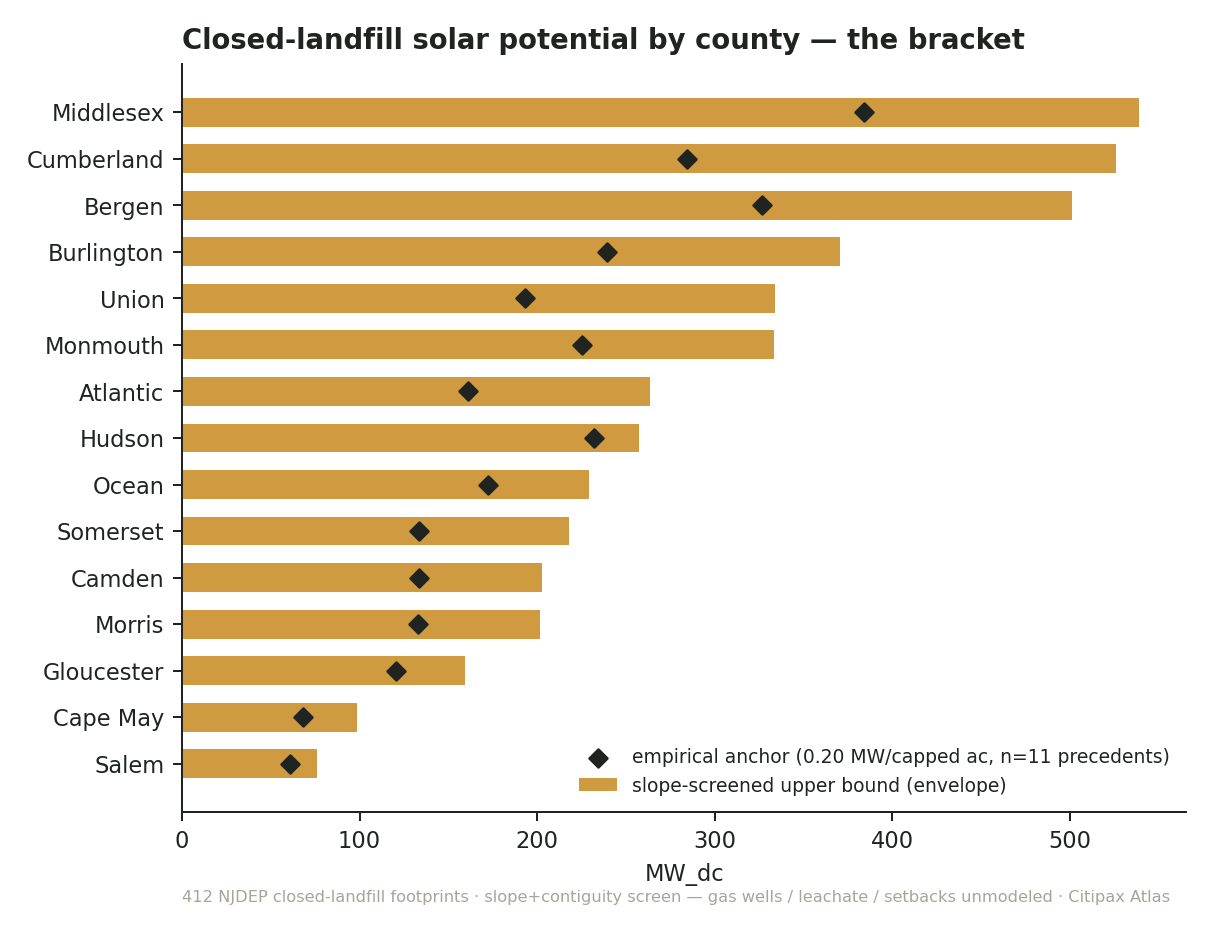
- Anchor (low side): total footprint acreage × 0.20 MW_dc/capped-acre — the empirical whole-cap coefficient (§ 3.7), which bundles the average built project’s real exclusions (infrastructure, setbacks, slope) into its 0.50 buildable fraction.
- Bound (high side): measured effective envelope acres × 0.40 MW_dc/array-acre packing density — replacing the assumed 0.50 fraction with per-site measurement while retaining the empirical packing density.
The two are not like-for-like — the anchor bundles what the bound cannot see — and that asymmetry is the point: reality, which removes infrastructure area from measured envelopes, lives between them. Per-site implied_buildable_fraction (envelope ÷ footprint, pre-aspect) is stored as the first statewide empirical check on the 0.50 assumption; its distribution (§ 5.3) confirms the assumption is conservative on flat NJ caps in exactly the direction the bracket construction expects.
4.3 Resolution-validation protocol (Bergen, model landfill-envelope-3ft-v0)
To test RQ2, Bergen County’s 31 footprints were re-enveloped from the 2014 point cloud directly, independent of the statewide product: 46 of 344 tiles intersecting site neighborhoods (387M points) were gridded at 1 m into bare-earth (per-cell mean of class-2 returns; bounded hole-fill at 3 m search distance) and first-return surfaces (per-cell max, class allowlist and the 400 m noise ceiling of § 3.3), converted meters→ftUS, and warped to a 3-ft EPSG:6527 grid (bilinear for bare earth; nearest for the max-surface, which must not be smoothed). The identical envelope method (§ 4.1, constants unchanged, grid-derived cell arithmetic) then ran at 3-ft resolution — 11.1× the cell density — under a separate model version, with sites outside the product’s coverage skipped rather than overwritten. Agreement statistics are reported in § 6.2.
4.4 Two-epoch settlement grading (model landfill-settlement-v0)
4.4.1 Registration. Epoch A is the statewide DEM (§ 3.2); epoch B the 2025 OPR DEM (§ 3.4). For each site, the A-grid window (snapped outward to whole 10-ft cells) defines the ground frame; the B window over identical bounds is block-averaged 10×10 onto the A grid (a 10-ft cell is valid when ≥ 50% of its 1-ft subcells are valid), with integral window registration asserted programmatically — a half-cell misregistration would alias slope into spurious change and is treated as a fatal error, never a warning.
4.4.2 Systematic removal. dz = B − A mixes true surface change with a systematic: epoch A’s geoid realization follows its source flight (e.g., GEOID12B for 2017-18 flights) while epoch B is GEOID18, plus any compiled-product bias. Rather than geoid-grid transformation, the systematic is removed empirically per site: the median dz over a stable ring (an annulus 100–600 ft outside the footprint, excluding the footprint itself) estimates the local offset, computed robustly — gross-change pre-filter at |dz| > 10 ft (construction/clearing must not contaminate the offset), then a two-pass median absolute deviation clip at 3σ using the consistency constant 1.4826 [9]. The ring’s post-clip robust spread (stable_ring_std_ft) is retained as the per-site sensitivity floor.
4.4.3 Error budget and grading. Specification-level per-point sensitivity for this epoch pair is ±0.15–0.23 m at 95% [10,12,23]; per-cap medians over hundreds-to-thousands of cells are far tighter, and the observed stable-ring floors in the pilot ran 0.28–0.59 ft with offsets between −0.86 and +0.20 ft (§ 6.3) — coherent, small, and cleanly removed. Grading applies documented thresholds to offset-corrected cap statistics: quiet (|median dz| ≤ 0.5 ft and < 5% of cells below −2 ft), active (median ≤ −1.0 ft, or ≥ 20% of cells below −2 ft, or median ≥ +1.0 ft — recent regrade/fill is also surface activity), moderate otherwise — with three NULL gates (≥ 100 analyzed cap cells; ≥ 200 stable ring cells; ring floor ≤ 1.0 ft) under the rule that a band is never assigned from insufficient or noisy data. Quiet means within sensitivity, not zero settlement; grades are prioritization signals and never geotechnical determinations [4].
4.4.4 Coverage discipline. Grading runs only where two epochs exist (Somerset at study date). Counties with one epoch report “not yet gradeable” — never a default grade — and the pipeline is armed to run per county as the B23 project’s workunits publish (§ 3.4).
4.5 Ownership and control classification (model landfill-site-control-v0)
Each footprint’s intersecting parcels (sliver floor 0.1 intersection-acre) are bucketed by property class: public/exempt (15A–15F), vacant (1), farm (3A/3B), improved private (2, 4A–4C), other. Dominance at ≥ 60% of classified intersection acreage assigns the site archetype and its control path: public-dominant → municipal RFP/lease; vacant-private-dominant → acquisition (the Mount Olive profile [17]); improved-private-dominant → owner partnership; otherwise assemblage. Sites bridging to no parcels carry NULLs. An assessment-trajectory distress proxy exists in the engine but is excluded from this publication by policy: distress signals attached to identifiable sites are not appropriate for a public document (§ 4.7); only the archetype counts appear here.
4.6 Known-built matching
EPA’s 28 New Jersey landfill installs (§ 3.5) were matched to registry footprints by normalized-name similarity (stopword-stripped SequenceMatcher ratio) with a municipality-corroboration bonus, auto-accepting at ≥ 0.85 and hand-adjudicating a 0.60–0.85 review band. The hand pass is itself a versioned artifact — a per-row override log recording every reassignment and rejection with its reason. Four traps it caught are instructive for anyone repeating this exercise: Kearny Landfill fuzzy-matched to Keegan (also in Kearny; no array) and was reassigned to the 1A landfill hosting the actual 2011 array [20]; Eagle Solar (Berkeley) matched Eagleswood Township on string similarity and was reassigned to Berkeley Township’s landfill [19]; Florence Landfill, LLC matched Lawrence Township (Cumberland) and was reassigned to Florence Land Recontouring (Burlington); and Ocean County Landfill (an active facility in Jackson Township, properly absent from the closed registry) matched OCEAN CITY (Cape May) at a perfect 1.0 after stopword collapse and was rejected. Final: 17 registry sites known-built, 2 EPA rows rejected as out-of-universe, 7 unmatched rows retained as reported (mall-adjacent and buffer-sited projects among them), zero unresolved. Conservatism note: unmatched real arrays would make the published “remaining” figure an overstatement of at most a few tens of MW; the direction and rough magnitude are stated rather than hidden (§ 7.6.3).
4.7 Privacy and data-governance methodology
This study operates under a strict wall between cadastral intelligence and public publication, designed around New Jersey’s Daniel’s Law and ordinary data ethics. Publication rules: county-level aggregates throughout; landfill site identities appear only as public NJDEP registry records and only with physical measurements attached; no parcel identifiers, no block/lot references, no owner names or classes attached to named sites, and no distress or financial signals attached to named sites; settlement grades attach to a named site only as a positive (stability) finding. The underlying engine reads owner-identifying data for none of the statistics published here; property-class rollups (§ 4.5) use class codes and geometry only. Machine-enforced sweeps (pattern batteries for identifiers, addresses, and coordinate shapes) run on this document as on every engine output.
4.8 Reproducibility
Every number regenerates from two committed scripts against versioned model outputs (landfill-envelope-v0, landfill-envelope-3ft-v0, landfill-site-control-v0, landfill-settlement-v0), each row of which snapshots its constants, inputs, and git commit. The county table, the known-built match log with overrides, and the top-sites table ship as CSV alongside this document (Appendix D).
5. Results
5.1 Statewide
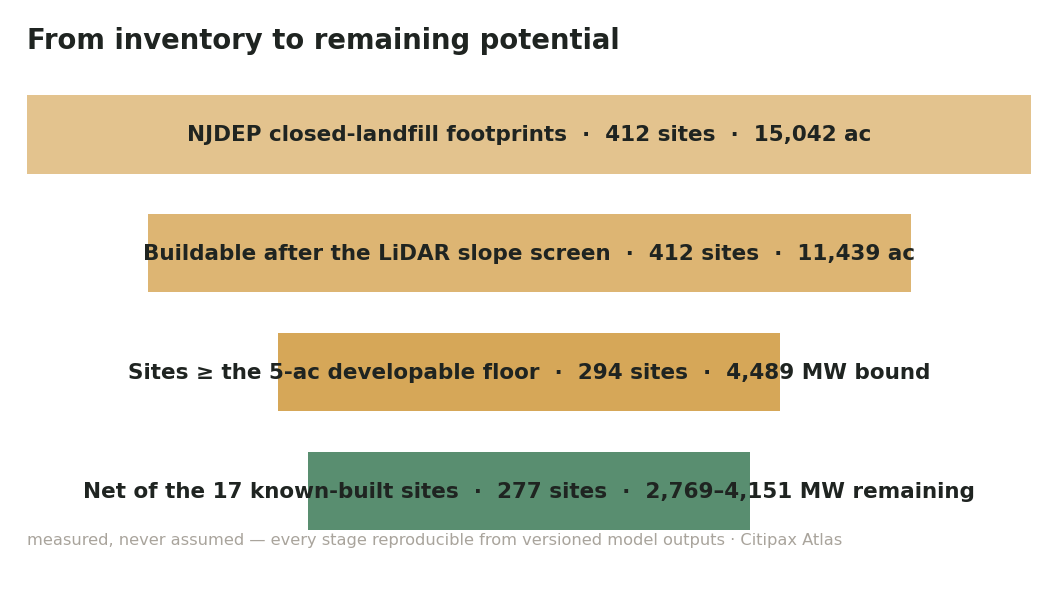
412 sites · 15,042 footprint acres · 11,439 slope-screened buildable acres · 294 sites (71%) at or above the 5-acre developable floor. Gross capacity brackets at 3,008 MW_dc (anchor) to 4,489 MW_dc (envelope bound); net of the 17 known-built sites (1,199 footprint acres; 338 MW of bound), 2,769–4,151 MW_dc remains. For scale: the net bracket is 9.2–13.8× the 300 MW carve-out [1], and 10–15% of the state’s ~27 GW remaining 2050 solar requirement [5].
5.2 The county distribution
Table 5.1 — All 21 counties (envelope model landfill-envelope-v0; anchor = footprint acres × 0.20 MW_dc/ac)
| County | Sites | Footprint ac | Buildable ac | Bound (MW_dc) | Anchor (MW_dc) | ≥5-ac sites |
|---|---|---|---|---|---|---|
| Middlesex | 46 | 1,920 | 1,377 | 538.6 | 384.0 | 34 |
| Cumberland† | 15 | 1,422 | 1,323 | 526.1 | 284.4 | 10 |
| Bergen | 31 | 1,632 | 1,276 | 501.0 | 326.3 | 21 |
| Burlington | 29 | 1,197 | 951 | 370.6 | 239.5 | 23 |
| Union | 14 | 965 | 844 | 333.7 | 193.0 | 13 |
| Monmouth | 27 | 1,127 | 855 | 333.4 | 225.5 | 22 |
| Atlantic | 31 | 807 | 670 | 263.3 | 161.3 | 24 |
| Hudson | 17 | 1,160 | 657 | 257.2 | 232.0 | 14 |
| Ocean | 27 | 861 | 586 | 229.3 | 172.1 | 25 |
| Somerset | 17 | 666 | 552 | 217.8 | 133.2 | 8 |
| Camden | 26 | 668 | 519 | 202.7 | 133.7 | 19 |
| Morris | 21 | 663 | 515 | 201.8 | 132.6 | 11 |
| Gloucester | 23 | 603 | 409 | 159.1 | 120.5 | 18 |
| Cape May | 14 | 340 | 252 | 98.7 | 68.1 | 12 |
| Salem | 15 | 305 | 194 | 76.0 | 61.0 | 13 |
| Sussex | 11 | 265 | 176 | 68.4 | 53.0 | 8 |
| Mercer | 9 | 139 | 108 | 42.2 | 27.7 | 6 |
| Essex | 11 | 84 | 66 | 26.2 | 16.9 | 4 |
| Warren | 11 | 136 | 59 | 22.9 | 27.2 | 5 |
| Passaic | 12 | 54 | 31 | 12.1 | 10.8 | 2 |
| Hunterdon | 5 | 28 | 20 | 7.6 | 5.6 | 2 |
† Dominated by the Leesburg polygon; see § 3.1, § 7.6.1. (Figure F1 visualizes the bracket per county.)
The distribution is heavily right-skewed by county and by site: the top three counties carry 35% of the statewide bound, and Hudson County — ninth by bound — carries the highest anchor-to-bound ratio (0.90) because its Meadowlands sites are large but steep-edged and water-adjacent, compressing envelopes toward the anchor.
5.3 Distributional statistics
Across all 412 sites the implied buildable fraction (envelope ÷ footprint, pre-aspect) has median 0.815 (IQR 0.566–0.928): New Jersey’s caps are, in the main, flat — flatter than the 0.50 fraction bundled into the anchor coefficient, exactly the direction the bracket construction anticipates (§ 4.2), with the gap between 0.815 (slope-only) and 0.50 (all-in empirical) itself an implicit estimate of how much area gas infrastructure, setbacks, and access consume on real projects. Forty-seven sites have no buildable cells at all; 118 fall below the 5-acre floor — the inventory’s long tail of slivers and remnants.
5.4 The largest measured envelopes
Table 5.2 (public NJDEP registry identities; slope-screen bounds, not project designs)
| Site | County | Buildable ac | Bound (MW_dc) |
|---|---|---|---|
| Leesburg Prison Landfill† | Cumberland | 1,110 | 442.9 |
| American Cyanamid | Somerset | 401 | 158.8 |
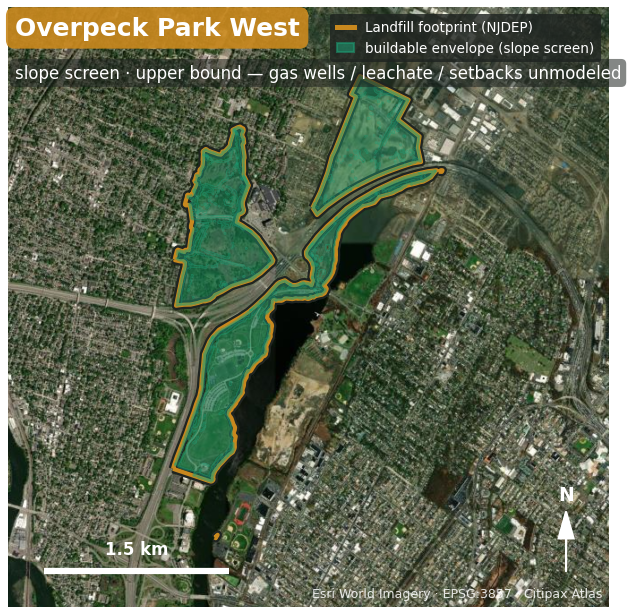
| Overpeck Park West (Teaneck) | Bergen | 389 | 152.7 |
| Edgeboro | Middlesex | 303 | 118.9 |
| Overpeck Park East (Leonia) | Bergen | 242 | 95.5 |
† § 3.1’s registry-semantics caveat applies in full; excluding Leesburg entirely lowers the statewide bound to 4,046 MW_dc (§ 7.6.1). The Overpeck pair illustrates a different diligence layer: both are, as their public names indicate, county parks today — enormous, flat, and encumbered by recreational use and, likely, Green Acres restrictions. The envelope measures physics, not permission; the control layer (§ 5.6) and local land-use diligence carry the rest. (Figure F4 renders Overpeck West’s envelope over aerial imagery.)
5.5 Known-built sites and repowering headroom
The 17 matched built sites [2] occupy 1,199 footprint acres with 338 MW_dc of measured bound — against roughly 80–90 MW_dc of actual installed capacity across the same sites per EPA records. First-generation projects took the easiest acres: Edgeboro’s 4.3 MW array sits on a 118.9 MW_dc envelope; Kearny 1A’s 3 MW on a 35-acre cap. Even where “built” is true, the built fraction of the measured envelope is small — a repowering and expansion frontier that subtraction-based accounting hides, and which we deliberately surface rather than net away silently (the published “remaining” figures subtract these sites’ entire bounds, making the remaining bracket conservative on this axis).
5.6 Control texture
By dominance archetype (§ 4.5): 209 sites municipal/public-path (2,303 MW_dc of bound — 51% of the statewide total); 92 owner-partnership (838 MW); 85 acquisition-profile (1,095 MW), of which 67 clear the 5-acre floor; 9 fragmented assemblages (202 MW); 17 bridge to no parcels (51 MW). Two readings. First, the municipal majority: more than half the state’s landfill-solar potential waits on public-sector counterparties deciding to run procurements — the carve-out’s uptake is, to first order, a local-government activation problem. Second, the acquisition-profile sites — the Mount Olive path [17] — are numerous enough (85) that the documented private route to site control is not an anecdote but a segment.
5.7 The settlement pilot (Somerset)
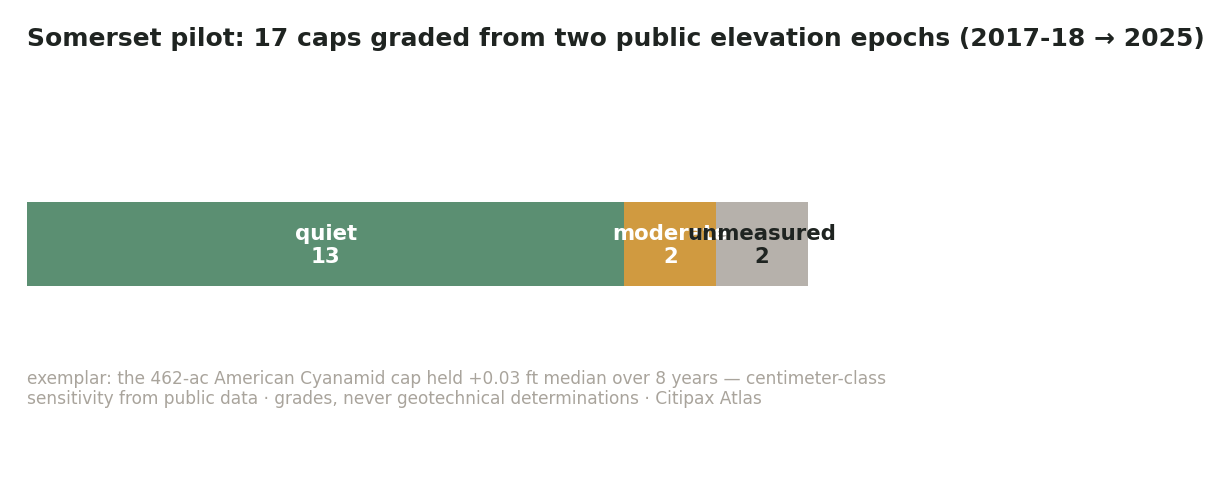
All 17 Somerset caps graded (§ 4.4): 13 quiet, 2 moderate, 2 ungradeable under the coverage gates (footprints too small for the 10-ft analysis grid) — with per-site systematic offsets between −0.86 and +0.20 ft (coherent with a geoid-realization difference plus product bias, § 6.3) and sensitivity floors of 0.28–0.59 ft. The two moderate grades are instructive rather than alarming: one (an 8-acre municipal cap) pairs a quiet median (−0.14 ft) with a −2.0 ft most-subsided decile — locally real movement that a median-only report would have hidden, and precisely the signal that routes a geotechnical budget. The headline stability result: American Cyanamid’s 462 analyzed acres moved +0.03 ft at the median over eight years — a famous Superfund closure measured stable at centimeter class, from public data. (Figure F5.)
5.8 Bergen County
The densest legacy inventory in the state (31 sites; 1,276 buildable acres; 501 MW_dc bound; two of the five largest envelopes) currently hosts zero operating landfill-solar projects — the state’s largest untouched concentration, in the carve-out’s EDC-agnostic geography. The 3-ft validation extraction (§ 6.2) doubles as a Bergen deep-dive: its five largest fine-grid envelopes are Overpeck West (365 ac / 142.5 MW), Overpeck East (233 / 91.7), Lyndhurst (154 / 60.3), Rutherford (71 / 27.8), and Kingsland (71 / 27.2).
6. Validation
6.1 Against built precedent
Mount Olive/Combe Fill North — the continent’s largest landfill array [17] — provides the sharpest single-site test: the screen bounds the footprint at 23.2 MW_dc; 25.6 MW_dc was built (the project’s array extends slightly beyond the registry footprint’s mapped extent, and its packing ran dense). The screen’s bound landed within 10% of an outcome it had no knowledge of, on the exact quantity it exists to estimate. Secondary precedent checks are consistent: every matched built array (§ 4.6) fits inside its site’s measured envelope, with built-to-bound ratios of 0.03–1.10 (median 0.21) — the single >1.0 case being Mount Olive itself.
6.2 Against finer data
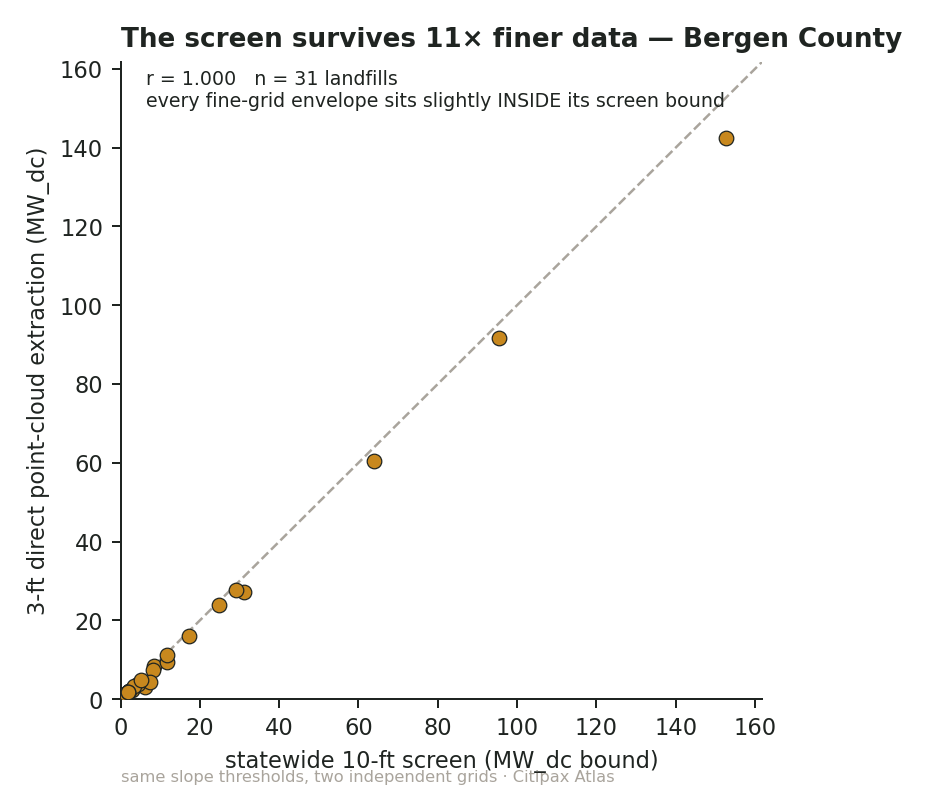
The Bergen re-extraction (§ 4.3) is a two-grid experiment: identical method, independent surfaces, 11.1× cell density. Across 31 sites, per-site bounds correlate at r = 1.000, the mean fine-grid envelope is 5% tighter, all 31 fine-grid envelopes fall at or inside their screen bounds, and rank order is exactly preserved. (Figure F3.)
v1.1 — statewide extension. After publication of the v1 draft, the point-cloud extraction was extended from the pilot county to the full inventory (source neighborhoods from all five underlying LiDAR collections; 408 of 412 sites carry a fine-grid envelope; the remaining four fall outside every collection’s tile coverage and are reported unmeasured). Across 361 site pairs with a positive screen bound, per-site bounds correlate at r = 0.998 with the fine grid a mean 11% tighter, and only three sites exceed their screen bound by more than 2% (all small envelopes at snapping boundaries). The pilot’s conclusion strengthens at twelve times the sample: for a screening product this is the target behavior — faithful ordering with a small, one-signed generosity — and it licenses statewide use of the 10-ft screen without per-site point-cloud work: finer data refines figures, it does not reorder decisions.
6.3 Internal coherence of the settlement method
The pilot’s per-site systematic offsets (−0.86…+0.20 ft) are consistent in sign and magnitude with the expected geoid-realization difference between epoch A’s source flights and GEOID18, plus compiled-product bias — and their site-to-site coherence within municipalities indicates the stable-ring estimator is capturing a real systematic rather than noise. Post-removal ring floors of 0.28–0.59 ft against grading thresholds of 0.5–2.0 ft give threshold-to-noise ratios of ≈2–7×; the two smallest footprints correctly refused to grade under the coverage gates rather than reporting noise as quiet — the honest-degradation behavior the method is designed around (§ 4.4.3).
7. Discussion
7.1 Against the national baseline
RMI’s 63 GW over 4,312 sites implies ≈14.6 MW/site nationally [3]; New Jersey’s measured inventory averages 10.9 MW/site at the bound and 7.3 at the anchor across all 412 sites — but the mean is a poor summary of a distribution whose median site bounds at ≈2 MW and whose top decile carries half the capacity. The measured state-level lesson for national estimation is less about level than about shape: registry-acreage methods overweight small remnants (our sub-floor 118 sites contribute almost nothing) and cannot see the single-digit number of very large caps that dominate a state’s total. A national re-estimate built on measured envelopes would likely redistribute more than it revises.
7.2 Carve-out sizing and design
The 300 MW carve-out [1] amounts to 7–11% of the measured net remaining potential. Read one way, the carve-out is comfortably fillable — 294 floor-clearing sites could satisfy it nine to thirteen times over, and its first-ready/first-served design will likely exhaust it well before its 2029 sunset if even a modest fraction of municipal owners act. Read the other way, the carve-out is small relative to the resource, and the binding constraints on landfill-solar deployment in New Jersey are not capacity-block size but (i) municipal activation (§ 5.6), (ii) per-site readiness engineering, and (iii) the incentive-economics calibration whose failure modes § 2.2 documents. The 24-month PTO allowance [1] addresses readiness time; nothing in the current design addresses municipal activation, which the data identifies as the majority constraint.
7.3 The municipal majority
Fifty-one percent of measured potential sits on public-dominant sites (§ 5.6). The precedent playbook for this segment is complete — RFP/lease structures with observed revenue at ≈$2,100/acre/year (GEMS [18]), close-with-solar financing for uncapped sites (Berkeley [19], BRI [16]) — but is exercised at a rate of a handful of municipalities per year. If the carve-out under-fills, the residual will not be geological.
7.4 The hard tail, quantified
The practitioner claim that easy sites are done [13] is directionally right and quantitatively incomplete. Of 294 floor-clearing sites, 17 are built and a similar order are in known development pipelines; the remainder skew toward exactly the profiles trade reporting describes — title-complicated vacant-private sites (85 acquisition-profile, § 5.6), never-assessed municipal remnants, and Meadowlands-class sites whose size coexists with wetlands adjacency and legacy-use encumbrances (the Overpeck caveat, § 5.4). The tail is hard; it is also, by measurement, where most of the remaining megawatts live.
7.5 Repowering as a hidden segment
Section 5.5’s built-fraction finding (median built-to-bound 0.21 on built sites) suggests the inventory’s already-built slice is itself a pipeline: modern densities, modern module wattages, and the carve-out’s economics make first-generation sites candidates for expansion within their existing disturbance footprints — a segment invisible to any accounting that treats “built” as binary, and one we flag for program designers considering whether carve-out eligibility should distinguish greenfield-cap from expansion projects.
7.6 Limitations, quantified where possible
7.6.1 Registry footprint semantics. The Leesburg polygon alone carries 443 MW_dc of bound (9.9% of statewide); treating it as a property boundary and excluding it entirely yields a statewide bound of 4,046 MW_dc and a net bracket of ≈2.6–3.7 GW_dc. No other single site exceeds 3.6% of the statewide bound, so the headline is robust to any one mapping error at the ±4% level and to Leesburg specifically at the −10% level (bound side). v1.1 refinement: the statewide fine-grid extraction (§ 6.2) measured the Leesburg surface directly — 1,079 buildable acres (427 MW_dc bound) at a 90th-percentile slope of 7%. The terrain is genuinely flat at engineering-adjacent resolution; what remains open is purely the records question of whether the registry polygon maps fill extent or property boundary. The caveat narrows from “may be overstated” to “physically real surface; boundary provenance unverified.”
Terrain vintage and post-flight consumption — measured, and the bracket revised (July 10, 2026). The elevation inputs date from New Jersey’s 2014–2021 LiDAR acquisitions (statewide 10-ft product: 2021); land use continues to change after any flight. We audited this directly against current aerial imagery (Esri World Imagery, vintage ≈2023–2025) in two strata: a census of the 31 highest-priority envelopes, and a stratified random sample of 40 of the remaining 381 registry sites (size-band × region × ownership strata; 618 MW_dc of bound sampled). Result: post-flight redevelopment has consumed ≈14% of the census stratum’s bound but only ≈3% of the sampled remainder — consumption concentrates precisely on the largest, most logistics-attractive corporate-legacy sites (the Linden corridor conversion is the archetype). The statewide estimate: ≈250–360 MW_dc consumed by redevelopment since the LiDAR era (point ≈300 MW_dc, ≈6–8% of the gross bound) — measured, we believe, for the first time anywhere. Per this study’s own decision rule, the headline bracket is revised from 2.8–4.2 to 2.6–3.9 GW_dc. Built solar observed in the audit is consistent with the 17-site netting already applied, so no netting revision is required; and the long tail of the inventory — hundreds of small and mid-size municipal caps — is ≈97% intact: redevelopment is eating the giants, not the base. Site-level figures now carry explicit verification tiers (model-claimed / record-verified / ground-truthed), and a current-imagery freshness check precedes any site-specific use. On the same audit, the Leesburg surface — flat as terrain — reads as predominantly forested state land with an active institutional campus: a terrain envelope, not open cap, consistent with the boundary-provenance caveat above.
7.6.2 Screen scope. The envelope cannot see gas wells, leachate systems, setbacks, or access (§ 4.1.5). The anchor-bound gap — 1,481 MW gross — is the study’s own estimate of the aggregate effect of everything the screen cannot see plus packing conservatism; per-site truth requires the cap-infrastructure survey that NJDEP’s process compels anyway [4].
7.6.3 Known-built conservatism. Matching is name-based against a December 2024 inventory [2]; projects completed 2025-26, buffer-sited arrays not on registry footprints, and unreported small systems are not subtracted. Directionally this overstates “remaining”; bounded by the observed size distribution of NJ landfill projects (median ≈5 MW [2]), the plausible overstatement is tens, not hundreds, of MW.
7.6.4 Cadastral artifacts. Stacked-lot double counting can inflate a site’s intersection acreage and skew its dominance call; the engine records per-site inflation ratios and the affected-site count is small, but § 5.6’s archetype counts should be read at ±small-integer precision, not as exact.
7.6.5 Aspect factors. The 1.00/0.95/0.85 orientation weights (§ 4.1.4) are judgment constants; because they apply only above 5% slope on mostly flat caps, their leverage on statewide totals is under 2%, but per-site effective acres on the steepest envelopes carry that uncertainty.
7.6.6 DEM vintage. Bound figures reflect source-flight dates (§ 3.2). The settlement pilot suggests most closed caps are quiet at multi-year scale (§ 5.7), but Bergen’s 2014-derived envelopes are twelve years old at publication; the county’s pending B23 workunit will permit re-extraction and grading on 2025+ surfaces (§ 3.4).
7.7 Future work
(i) Statewide re-extraction as B23 workunits publish, retiring the vintage caveat county by county and extending settlement grading beyond the pilot; (ii) municipal tax-sale-certificate data, converting the acquisition-path proxy into ground truth; (iii) a plane-of-array simulation study to retire the judgment aspect factors; (iv) gas-well and leachate-infrastructure layers where operators publish them, closing part of the screen-scope gap; (v) automated built-array detection from imagery/NDVI to replace name matching; (vi) replication in neighboring states whose registries and LiDAR support it, toward a measured multi-state baseline.
8. Conclusion
Measured rather than assumed, New Jersey’s closed-landfill inventory holds roughly 2.6–3.9 GW_dc of remaining solar potential — nine to thirteen times the capacity the state just reserved for it, concentrated in a minority of large, mostly publicly controlled sites, validated against built precedent, finer data, and time. The number’s utility is not its size but its resolution: county by county, site by site, with buildability, control path, and (increasingly) stability measured at screening cost from public data. The 300 MW race that began in March 2026 will be won by whoever converts that resolution into readiness fastest; the state’s 2050 arithmetic suggests the carve-out is the first tranche of a much larger draw on the same inventory.
Disclosure
Citipax Atlas LLC, the author’s firm, sells county screening and site-level readiness analyses built on the engine described in this study. The study publishes county aggregates and public-registry site measurements precisely so that its headline claims are verifiable independent of any commercial engagement; all methods, constants, and match logs are disclosed herein, and the reproducibility artifacts (Appendix D) permit independent regeneration of every figure.
References
- New Jersey Board of Public Utilities, Order — Community Solar Energy Program, Energy Year 2026 Capacity Block, Docket QO22030153, March 4, 2026 (effective March 6, 2026).
- U.S. Environmental Protection Agency, RE-Powering America’s Land Initiative: Project Tracking Matrix, EPA 540-R-24-002, December 2024.
- M. Popkin and A. Krishnan, The Future of Landfills Is Bright, Rocky Mountain Institute, November 18, 2021.
- New Jersey Department of Environmental Protection, Division of Sustainable Waste Management, Guidance for the Permitting of Solar Energy Systems on New Jersey Landfills, updated February 2024.
- New Jersey Department of Environmental Protection, Solar Siting Analysis, Version 3.0, 2024.
- S. Ong, C. Campbell, P. Denholm, R. Margolis, and G. Heath, Land-Use Requirements for Solar Power Plants in the United States, NREL/TP-6A20-56290, National Renewable Energy Laboratory, 2013.
- M. Bolinger and G. Bolinger, “Land Requirements for Utility-Scale PV: An Empirical Update on Power and Energy Density,” IEEE Journal of Photovoltaics, vol. 12, no. 2, 2022.
- B. K. P. Horn, “Hill shading and the reflectance map,” Proceedings of the IEEE, vol. 69, no. 1, pp. 14–47, 1981.
- P. J. Rousseeuw and C. Croux, “Alternatives to the Median Absolute Deviation,” Journal of the American Statistical Association, vol. 88, no. 424, pp. 1273–1283, 1993.
- U.S. Geological Survey, Lidar Base Specification 2023, Revision A.
- U.S. Geological Survey, 3DEP Work Unit Extent Spatial Metadata (WESM) and staged-products repositories, accessed July 1–2, 2026.
- National Oceanic and Atmospheric Administration, Digital Coast dataset 4921 (2014 USGS CMGP Post-Sandy LiDAR, New Jersey), InPort record 49867.
- Waste Dive, “Landfill solar projects still have a bright future, but face practical limitations,” February 2, 2026.
- NJ Spotlight News, “Solar arrays on landfills, contaminated sites hit snags under new subsidy regime,” June 2022.
- N.J.A.C. 14:8-11 (Community Solar Energy Program, permanent rules, adopted August 2023); L. 2023 c.200; L. 2025 c.135; N.J. Executive Order No. 2 (January 2026).
- New Jersey Economic Development Authority, Brownfields Redevelopment Incentive; State of New Jersey landfill-solar program portal (nj.gov/landfillsolar).
- CEP Renewables, “CEP Renewables Completes Largest Landfill Solar Project in North America” (press release), December 2022; New Jersey Resources, Clean Energy Ventures release, November 30, 2022.
- Syncarpha Capital, GEMS Landfill PV project records and ASCE-NJ 2023 Project of the Year announcement, 2023.
- Solar Builder Magazine, “CS Energy, Luminace complete landfill community solar in New Jersey” (Eagles Solar I & II, Berkeley Township), October 2024.
- PSE&G, Solar 4 All program factsheet (landfill and brownfield portfolio), c. 2016; New Jersey Sports & Exposition Authority, solar projects records (Kearny 1A).
- Citipax Atlas, NJ/Northeast Landfill-Solar Capacity-Density Coefficient v1 — empirical derivation and evidence base, June 26, 2026 (published with this study’s data artifacts).
- Rocky Mountain Institute, Know Before You Go…to the Brightfields Market (factsheet), July 2025.
- American Society for Photogrammetry and Remote Sensing, Positional Accuracy Standards for Digital Geospatial Data, Edition 1, 2014.
- Solar Act of 2021, P.L. 2021, c.169 (New Jersey).
- Solar Power World, “WM will build solar on at least 50 former landfills” (WM–Reactivate agreement), January 2026.
- New Jersey Board of Public Utilities, Order — Competitive Solar Incentive Program, Third Solicitation Awards, March 4, 2026.
Appendix A — County table
Table 5.1 is complete (all 21 counties); the machine-readable version ships as county_table.csv with this study’s data artifacts.
Appendix B — Constants registry
| Constant | Value | Rationale (documented in engine calibration) |
|---|---|---|
| Slope class: prime | ≤ 8% | Ballasted-racking comfort zone on cap plateaus (precedent base) |
| Slope class: conditional | 8–15% | Buildable with engineering review; approaching side-slope regime |
| Slope class: excluded | > 15% | Side-slope regime (typical landfill side slopes 25–33%) |
| Minimum contiguous component | 2 ac (871 cells @10 ft) | Sub-2-ac fragments cannot host a sub-array + access |
| Developable floor (flag) | 5 ac | Practitioner sizing rule ≈5 ac/MW [22]; never drops a site |
| Aspect factors (slope > 5%) | S 1.00 / E–W 0.95 / N 0.85 | v0 judgment; flagged weakest constants (§ 7.6.5) |
| Packing density | 0.40 MW_dc/array-ac | Empirical, n = 11 unique built arrays [21] |
| Anchor coefficient | 0.20 MW_dc/capped-ac | 0.50 empirical buildable fraction × packing density [21] |
| Settlement ring | 100–600 ft annulus | Outside cap-edge slopes; local systematic estimation |
| Gross-change pre-filter | |dz| > 10 ft | Construction/clearing excluded from offset estimation |
| MAD clip | 3σ (1.4826·MAD) | Robust estimator [9] |
| Band thresholds | quiet ≤0.5 ft; active ≥1.0 ft median or ≥20% < −2 ft | Feet-scale thresholds ≫ per-point floor (§ 4.4.3) |
| NULL gates | ≥100 cap cells; ≥200 ring cells; ring σ ≤ 1.0 ft | A band is never assigned from insufficient/noisy data |
| Match thresholds | auto ≥0.85; review 0.60–0.85 | Conservative; hand pass logged per row (§ 4.6) |
Appendix C — Known-built match log (summary)
Seventeen registry sites accepted as built (eight auto-matched, twelve via logged overrides including three reassignments; two EPA rows rejected as out-of-universe: an active facility and a non-registry industrial monofill; seven EPA rows unmatched to registry footprints and retained as reported). The full per-row log — scores, corroboration, verdicts, and reasons — ships as epa_match_review.csv and epa_match_overrides.csv.
Appendix D — Data & figure availability
county_table.csv · top10_public.csv · epa_match_review.csv · epa_match_overrides.csv · summary.json (all statistics) · figures F1–F5 (PNG) · generation scripts analysis/flagship_study_v0.py, analysis/flagship_figures_v0.py. Versioned model outputs cited in § 4.8. Landfill site identities throughout are public NJDEP registry records; no parcel-owner information appears in, or was used for, the public statistics in this study.
© 2026 Citipax Atlas LLC.
Part of Research & Evidence — the literature and method behind the Atlas screen.